Click here for text parameters
Now comes the interesting part -- seeing a processed 1-D spectrum for the first time! The standard IRAF task apall in the twod --> apextract package does a fine job of interactively extracting a spectrum from our combined image. However, apall is another of those "kitchen sink" tasks and therefore deserves a little explanation of what it's doing:
What is it doing?
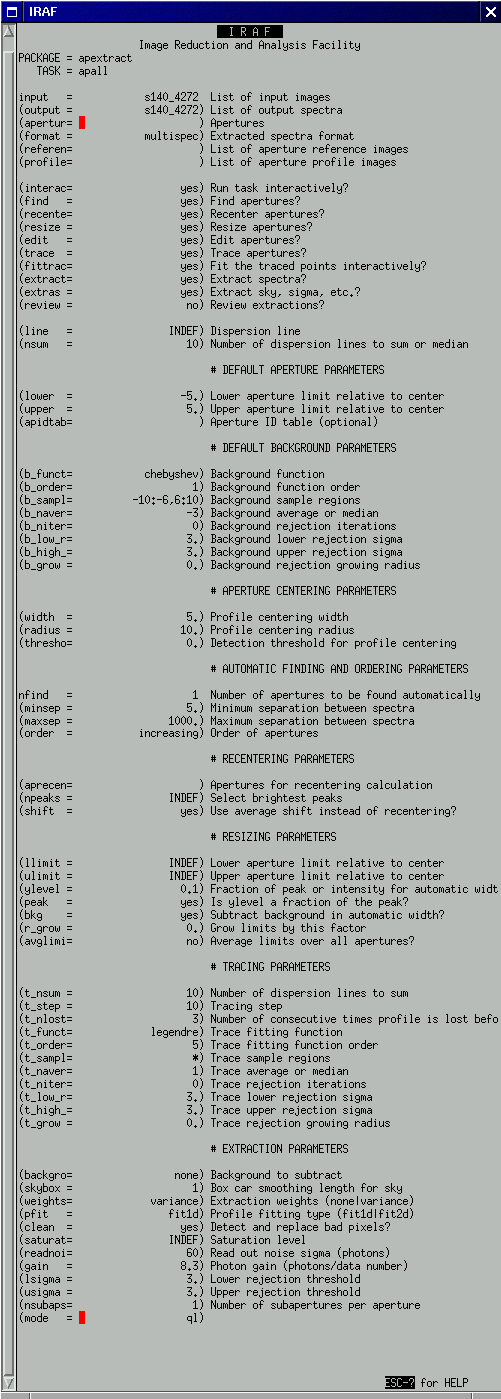
Not too bad, huh? Let's look at its many parameters. The list is so long that I have highlighted only the ones you might need to change during your lifetime with a red dot:

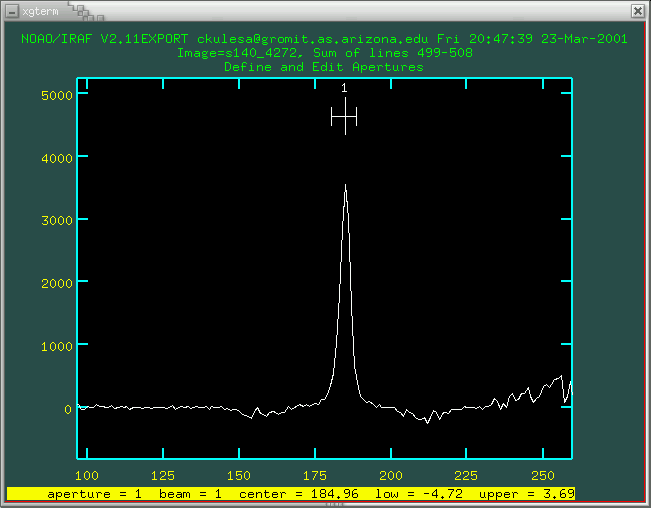
Pretty dizzying, huh? Fortunately, you won't touch more than two lines per processing run after the first time you setup and run apall. Okay, let's run it (:g, remember?). The first thing you will see is a screen allowing you to identify the aperture(s) you wish to extract. It is averaging a few rows in the middle of the array and presenting that 1D slice to you, just like our image aligning exercise, earlier.

It probably has identified an aperture for you, and should have re-sized and centered it for you. In case it has botched it, here is a table of very basic aperture extracting commands (for the rest, type help apedit):
| Keystroke | Effect |
| n | New Aperture |
| g | Recenter an Aperture automatically |
| z | Re-size an Aperture automatically |
| u | Set upper limit of aperture to current cursor position |
| l | Set lower limit of aperture to current cursor position |
| d | Delete Aperture |
| r | Redraw the graph |
| q | Quit |

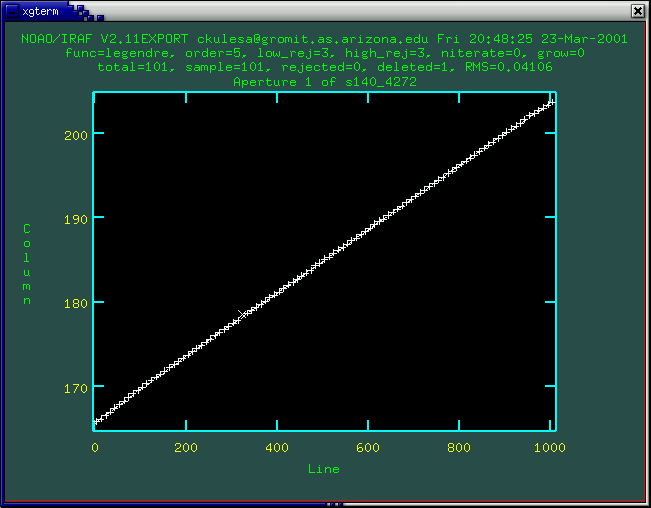
It should do a good job with little hand-holding. A 3rd-5th order function should get it dead-on; as before, :o [num] and then f sets the order to [num] as it did with response or nearly any other interactive fitting routine in IRAF. There may be one or two errant points, especially if there are portions of your spectrum with low flux (i.e. deep absorption lines in your object or the atmosphere). You can move the cursor over them and hit d to delete them, and refit with f. Hit q when you're done.
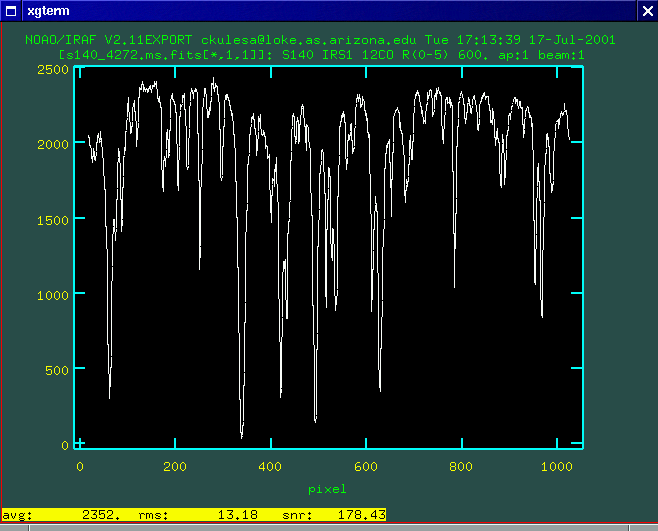
Apall will now extract your spectrum, subject to the profile fitting, variance weighting, and bad pixel rejection in its parameters. You can now type splot to plot your extracted spectrum and bask in its glory.

Well, almost. As you can see, our spectrum has wonderful signal-to-noise ratio (S/N = 180), but atmospheric features completely dominate. It's time to remove these pesky features...
 Combining Images Combining Images |
Removing Atmospheric Features  |