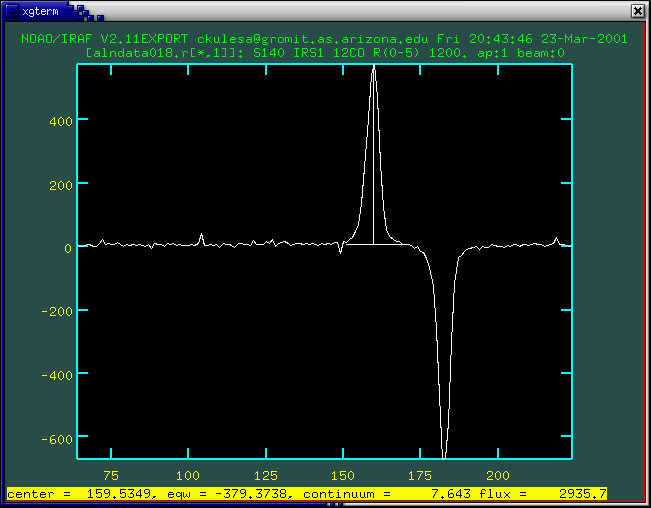
So lets do that! The file containing the names of the slices is alnlist, and we will use the task splot (in the oned package) to interactively perform the centroiding and flux measurements. Inspect the file list and make sure it has the files you want (it may also contain files from a previous phxproc run). Also remove any old splot log files:
!rm splot.log
splot @alnlist

To mark the centroid and measure the flux, hit e at the continuum level on one side of the peak, then e on the other side. While you can use k instead, to fit a Gaussian profile, properly-focused pre-1999 Phoenix data had a double-peaked profile that isn't well fit by a single Gaussian. Using e just blindly sums the flux and makes the fewest assumptions about the distribution of flux, which is why I still recommend it.
Hit q to move onto the next frame after measurement.
When you're done, we're ready to assemble the images.
Part II: Combining Images
Now we're ready to assemble our images into a single frame. A lot
actually happens in this step, and it's worth spending a moment to
discuss what we want to do:
As you can see, we've done a lot of thinking here. :) All of this is done by the Phoenix task ircombine. First, let's use nalign to turn splot's log file into useful information for ircombine:
nalign splot.log 4
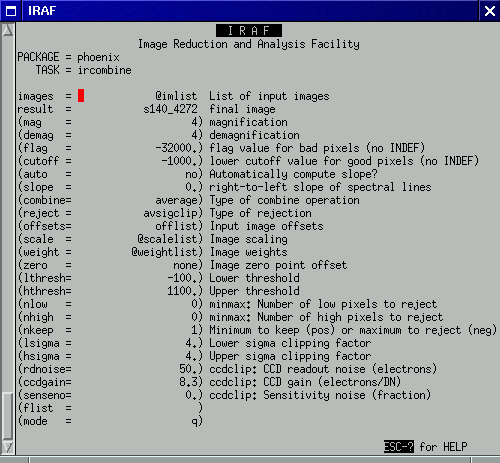
This example states our intentions to magnify images by a factor of 4 during image combination. nalign creates a new imlist file, as well as files containing the new integer offsets, flux scaling for each image, and statistical weights for each image. Now it's time for ircombine:

Note that we are combining in the average, not in the median, and that offlist, scalelist, and weightlist contain the offsets, scaling factors, and statistical weights, respectively. Pixel values between -100 and 1100 are considered acceptable; this must be determined by inspection for each data set. We are using the avsigclip pixel rejection algorithm, with a very conservative 4-sigma cutoff.
Hit :g, and ircombine will crunch through the images and provide a final combined image. If you used a large-ish (>2) magnification factor, this process might actually take a while.
Here is the combined spectrum for S140:

 Using PHXPROC Using PHXPROC |
Extracting 1D Spectra  |