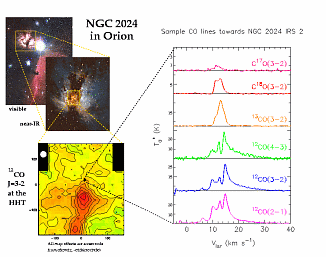
A CO study of the NGC 2024 cloud core, taken at the HHT in 1997 and 1998. Click on thumbnail image to view full-size.

On-source integration times tend to be rather short at submillimeter wavelengths, typically 15 seconds or so. Using position switching, this integration time is typically limited by the very transient stability of the atmosphere. In fact, on-the-fly (OTF) mapping techniques adopt very short integration times (2-4 seconds for slow OTF, small fractions of a second for rapid OTF) to map as large a portion of the sky in as short a time as possible. Beam-switching moves the telescope rapidly (a few Hz) between source and clean sky, so this becomes less of an issue. However, receiver and spectrometer stability often place a practical limit on the integration times used; even in beam-switching mode, observers will frequently switch between the OFF and ON source beams, perhaps every 30-60 seconds or so.
Because of these restrictions, in order to perform sensitive spectroscopic observations, many separate integrations must be coadded and weighted. In addition, basic instrumental features, like offset baselines and bad scans must be eliminated. Regularly sampled spectral line maps are easy to assemble and convolve to the natural beamsize. In contrast, randomly-sampled on-the-fly maps must be specially handled, typically convolved and gridded to yield similar results. Moment maps can be constructed, yielding imagery of the integrated intensities, line centroid velocities, and line widths. Channel maps, in which the integated intensity map is chopped up into separate maps at different velocities, may also be constructed. Finally, spectra and maps can be annotated to result in a plot that is suitable for publication.
Ready to go?
Well, we're starting anyway. :)
 Index Index |
 Reduction Home Reduction Home |
 Installing GILDAS Installing GILDAS |