
| Submillimeter-wave Spectroscopy of Molecular Clouds and Star-Forming Regions |
Below is a depiction of the NGC 2024 star-forming region. The visible image shows a dark, dusty molecular cloud. As one moves to longer wavelengths, one can probe through the obscuring material and see the newly-born stars buried within (infrared image). At the SMT, we have mapped out CO and its isotopes towards NGC 2024. The 12CO J=3-2 rotational transition is mapped out at the bottom-left of the figure, and you can see that it peaks in intensity at the same location where the stars are being formed and where the obscuration is the highest. At each pixel in this map, we have spectra of CO in several rotational transitions, each of which has different requirements for excitation. Thusly, each transition probes different material in the cloud, and therefore tells a different story. In addition, we have observed the isotopically rarer species like 13CO, C18O, and C17O. A sampling of these lines is portrayed for a single point in the map; the same point for which we have detected H2, H3+ and CO directly in the infrared.
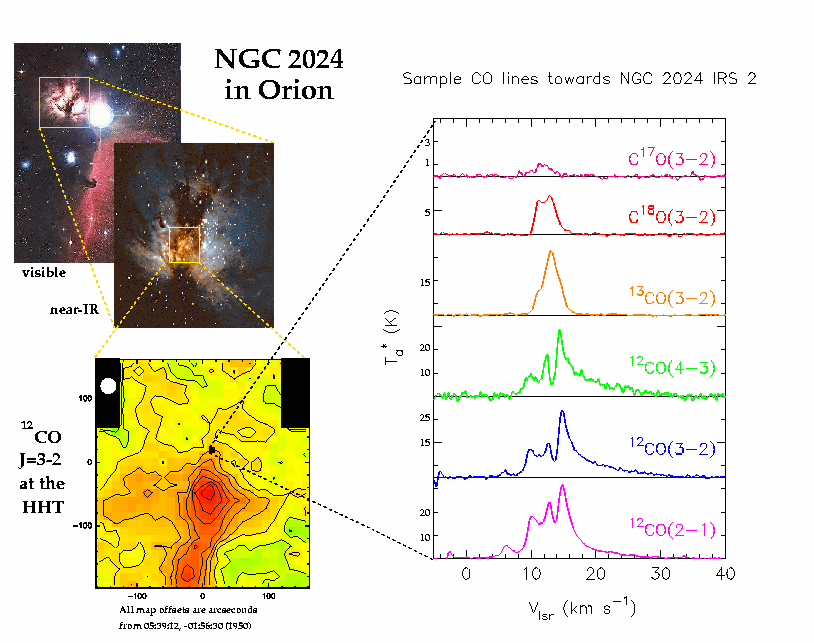
Notice the difference in the line profiles. This gives us direct information on the distribution of molecular material in the cloud, and in principle can be used to construct a three-dimensional picture of the cloud. In practice, this exercise is frustrated by the simultaneous effects of line saturation and radiative transfer, changes in the line excitation and elemental abundance variations across the source. These difficulties are not nightmares best forgotten, but rather are important diagnostic tools; by careful modeling, there is still an incredible amount of information that can be gleaned from these spectral line maps.
Looking at the distribution of spectral lines in molecular clouds can be visually illuminating. We have performed a comprehensive spectral line survey of the rho Ophiuchi molecular cloud. Below is an image of the submillimeter continuum emission from interstellar dust, courtesy of Doug Johnstone, and made with SCUBA at the JCMT; atop which we overplot the scope of our spectral line maps.
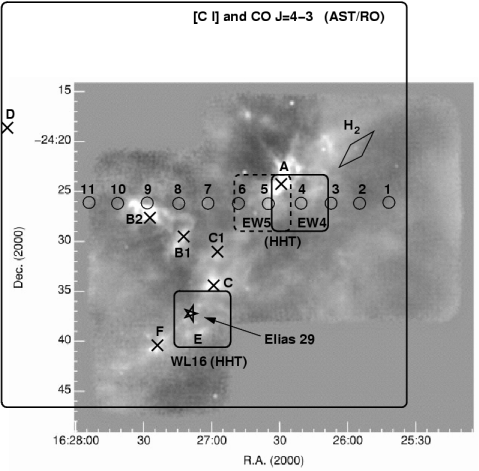
We use the AST/RO telescope to map out the entire cloud in submillimeter CO J=4-3 line emission at 461 GHz, and atomic carbon in the 3P1-3P0 transition at 492 GHz:
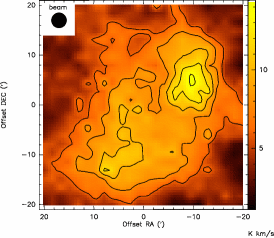
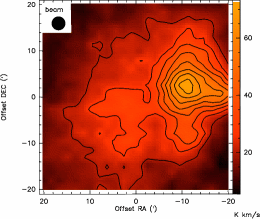
The small box marked "EW4" in the rho Oph overview is mapped with the 10-meter HHT in numerous molecular lines with 3000 AU resolution:
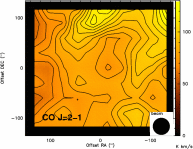
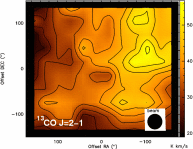
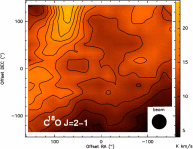
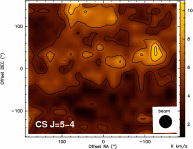
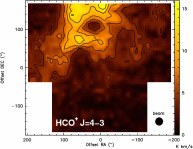
It is stunning to see how different molecular species probe different components of the cloud. The different lines of CO probe different depths into the cloud, owing to line opacity. HCO+ and CS both probe dense gas, yet look entirely different due to chemistry that enhances their abundances in different situations. Atomic carbon's abundance is a function of the incident ultraviolet radiation field and the subsequent shielding efficiency of dust grains and hydrogen molecules. All of these issues allow us to disentangle some of the complicated structure of molecular clouds and star forming regions.
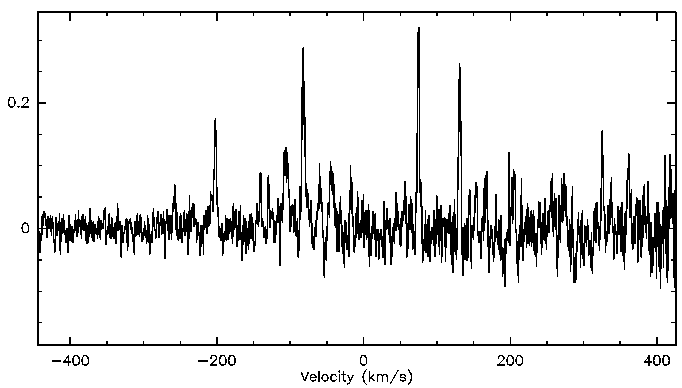
Analysis of these lines allows us to use methanol as a kind of thermometer, probing the temperature of the material close to the star. In this case, observations of methanol bands at 241 and 338 GHz yield an estimate of the gas temperature where the methanol is being processed, of about 320 Kelvin (about 50C or 120F). This is very warm compared to the ambient cloud gas, which is at a temperature of about 40K (-233C, or -390F).
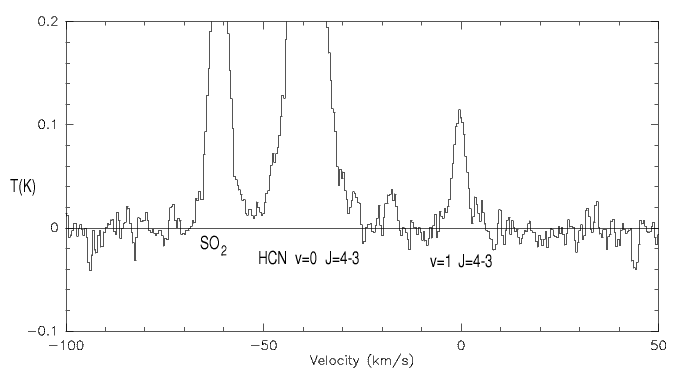
These high-temperature probes can be taken to an extreme. Adjacent to the bright, purely rotational 4-3 transition of HCN (hydrogen cyanide) at 354 GHz is a weak feature (in the center of the bandpass) due to the 4-3 rotational transition from a vibrationally-excited state. Comparison of this feature in the 3-2 and 4-3 transitions yields the gas temperature of collisionally-excited HCN, which is of the order of 1000K (700C, or 1300F). Most of the HCN vibrational emission is radiatively "pumped" from the bright mid-infrared continuum emission of the central source (GL 2591), yielding the location of the HCN emitting gas.
 Back to Craig's Research Projects
Craig Kulesa Last modified: Tue Apr 16 15:29:13 MST 2002