A Quick Cookbook to Using Karma
Installing Karma
Download the latest version of Karma and install to the /usr/local directory. If you do not have access to /usr/local because you do not have root/administrator access, then install it wherever you like. If you use a Bourne shell (sh, bash, etc.) then type the following, replacing /home/ckulesa/src with the path to wherever you put karma.
export KARMABASE=/home/ckulesa/src/karma
export LD_LIBRARY_PATH=${LD_LIBRARY_PATH}:/home/ckulesa/src/karma/lib
If you use a csh-like shell, then do this instead:
setenv KARMABASE /home/ckulesa/src/karma
setenv LD_LIBRARY_PATH ${LD_LIBRARY_PATH}:/home/ckulesa/src/karma/lib
Now try to run one of the karma tools.
/home/ckulesa/src/karma/bin/kvis
Running Karma
The initial kvis window will look like this:

Open a 3D data file using the file menu. The dialog box will look like this:
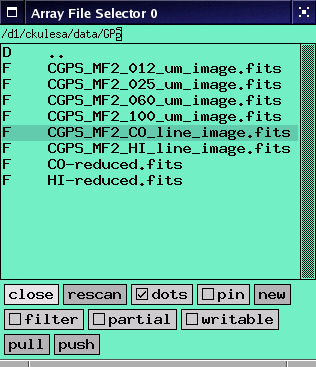
If you are going to open a file that is too large to fit into memory, consider selecting the Filter option. When you select a file, it will give you the opportunity to "bin" the file, reducing its resolution and memory footprint.
The image you loaded will be in grayscale. To pick a color scheme, select the intensity menu item. Select one of the color mappings. GlynnRogers2 is a decent one that is typical of other radio astronomy packages like AIPS and MIRIAD.

Let's put a scale on the image. Select the Overlay menu item and select Axis Labels. You will get this window:
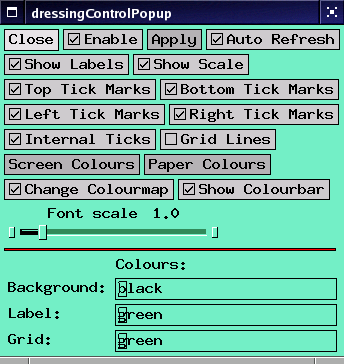
Select Enable and Show Colourbar.
Now let's move on to the View menu. Selecting it, you will get this dialog box.

Select Show Marker in Line Profile and then Movie. Yet ANOTHER window will pop up:
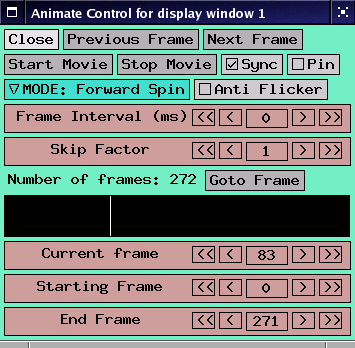
Here's where you can select which 2D "slice" of the 3D image to plot. Each movie frame shows the intensity of radio light at a different frequency! Use the MIDDLE mouse button in the black rectangular area to select a spectral channel. Here is an example of such an image:

Try using the movie controls to view all of the frames of your 3D image.
When you find a particular frame that you like, go back to the View window and select Profile Mode to be Line as shown here:
When you do this, a separate window will pop up which will contain the spectrum of whatever point in the map that you select with the mouse cursor. If you use the Overlay menu to put an axis scale on the plot, and select a histogram-style plot from the Style menu, the results will look like this:

The dashed vertical line in the spectrum identifies which spectral channel is being displayed in the main viewer. Try running a movie while also having the spectrum window open -- you'll see the dashed line march across the spectrum as the movie plays.
Links
Craig Kulesa
18 May 2007