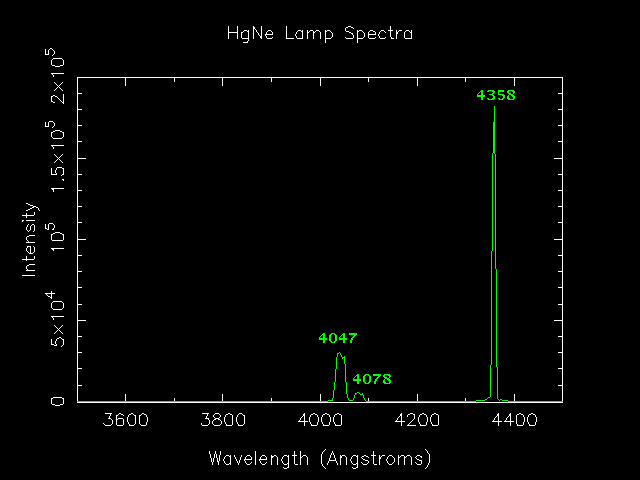
4000 Angstroms
Click here for a Postscript version
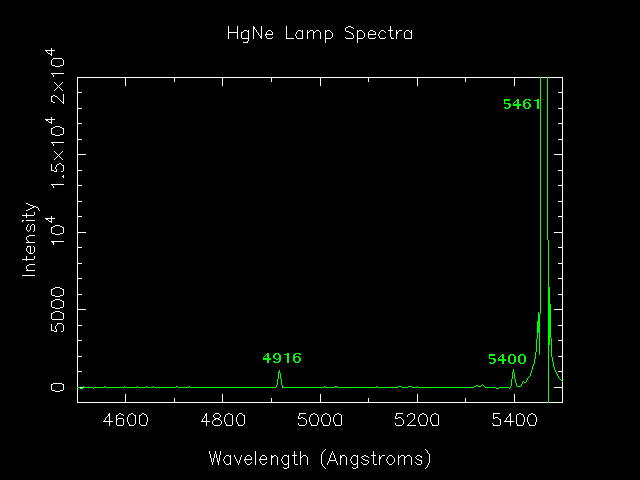
5000 Angstroms
Click here for a Postscript version
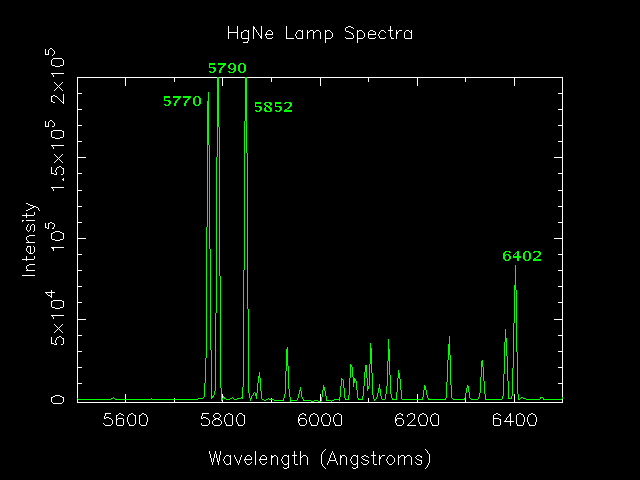
6000 Angstroms
Click here for a Postscript version
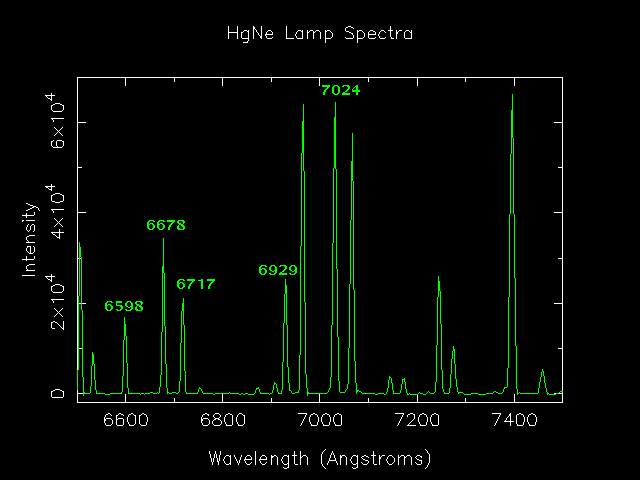
7000 Angstroms
Click here for a Postscript version
The following are processed comparison lamp spectra from 4000 Angstroms (400 nm, 0.4 microns) to about 7000 Angstroms (700 nm, 0.7 microns). Especially prominent features are identified on the plots, although each feature is identified in the Hg-Ne linelist as part of my CampSPEC script. If you identify at least 2 lines, the script will identify the rest and fit a smooth function to the dispersion axis.
The plots are available for browsing in GIF format, or printed as Postscript files.
Click here for a Postscript version
Click here for a Postscript version
Click here for a Postscript version
Click here for a Postscript version